Top 20 Data Analysis Tools and How to Choose the Right One for Your Needs

Table of Contents
The global data analytics market is projected to reach $279.3 billion by 2030, growing at a 27.6% CAGR — and choosing the right data analysis tool is one of the most consequential technology decisions organizations make in 2026 (Grand View Research, 2024). The right tool determines how fast teams can move from raw data to strategic decisions, how well insights scale across the organization, and how effectively non-technical stakeholders can engage with data. This guide reviews 20 of the top data analysis tools available today, details their strengths, limitations, and pricing, and provides a structured framework for choosing the right solution for your specific needs.
Last updated: March 2026
How Do You Choose the Right Data Analysis Tool?
Selecting the right data analysis tool is critical for maximizing your team’s efficiency and delivering actionable insights. According to Gartner (2024), 67% of organizations that fail to realize ROI from analytics investments cite poor tool-fit as the primary cause — selecting a platform that doesn’t match team skill level, use case, or integration requirements. Here are the seven most important factors to evaluate before committing to a platform:
- Purpose and Use Case
Define what you need the tool for. Are you looking for advanced statistical analysis, business intelligence, machine learning capabilities, or real-time reporting? Clarifying your goals will narrow your options significantly. - Ease of Use
Assess the technical expertise of your team. Some tools require coding or advanced skills (e.g., R, Python), while others offer intuitive interfaces for non-technical users (e.g., Tableau, Power BI). - Integration Capabilities
Check how well the tool integrates with your existing systems, such as databases, cloud storage, and business applications like CRM or ERP platforms. - Scalability
Consider whether the tool can grow with your organization. Scalability is vital for businesses expecting data volumes to increase over time. - Cost and Budget
Understand the pricing structure of each tool. Some have free or affordable plans, while others may require a significant investment for enterprise-grade features. - Collaboration Features
If your team works collaboratively, look for tools that allow sharing of insights, dashboards, and data sets in real-time. - Customer Support and Community
Reliable customer support and active user communities can make a significant difference when you encounter challenges or need customization guidance.
By evaluating these factors systematically, you’ll be equipped to choose a tool that aligns with your requirements and empowers your team to make data-driven decisions.
What Are the Top 20 Data Analysis Tools in 2026?
As Cassie Kozyrkov (Chief Decision Scientist, Google) has observed: “The best analytics tool is not the most powerful one — it’s the one your team will actually use consistently and correctly.” With that principle in mind, the 20 tools below span the full spectrum from no-code BI platforms to advanced data science environments, covering every team size, budget, and use case.
1. Microsoft Power BI
Microsoft Power BI is a powerful analytics and visualization tool that seamlessly integrates with Microsoft products and a variety of other data sources. It offers real-time data sharing and is widely appreciated for its user-friendly interface. With over 250,000 organizations using Power BI globally (Microsoft, 2024), it is the world’s most widely deployed BI platform.
Pros:
- Real-time data streaming and sharing capabilities.
- Seamless integration with other Microsoft tools like Excel and Azure.
Cons:
- Complex pricing structure.
- Can be overwhelming for beginners due to its advanced features.
Pricing:
Free tier available; Pro plan starts at $9.99/user/month.
2. SAP BusinessObjects
SAP BusinessObjects is a comprehensive business intelligence suite that offers tools for reporting, data visualization, and predictive analysis. Its robust functionality is ideal for large enterprises managing complex datasets across global operations.
Pros:
- Highly customizable reporting and dashboards.
- Integration with SAP’s enterprise systems and third-party tools.
Cons:
- Steep learning curve for non-technical users.
- High implementation and licensing costs.
Pricing:
Custom pricing based on enterprise needs.
3. Sisense
Sisense is known for its ability to simplify complex data by offering embedded analytics and customizable dashboards. It is particularly popular among small to medium-sized businesses seeking user-friendly solutions without sacrificing analytical depth.
Pros:
- Highly customizable and user-friendly dashboards.
- Excellent scalability for growing businesses.
Cons:
- Limited real-time analytics features compared to competitors.
- Performance can lag with extremely large datasets.
Pricing:
Custom pricing available upon request.
4. SAS Business Intelligence

SAS Business Intelligence is a robust platform offering advanced analytics, data visualization, and reporting capabilities. It is widely used in industries — including healthcare, financial services, and government — requiring deep analytical insights and predictive modeling.
Pros:
- Comprehensive analytics and data visualization tools.
- Strong capabilities for predictive modeling and forecasting.
Cons:
- High costs for licensing and implementation.
- Requires technical expertise for effective use.
Pricing:
Custom pricing based on enterprise needs.
5. ThoughtSpot
ThoughtSpot is a cutting-edge analytics platform designed to provide instant insights through AI-powered search functionality, making it easy for non-technical users to analyze complex data using natural language queries.
Pros:
- AI-driven search analytics for quick insights.
- Easy to use, even for non-technical teams.
Cons:
- Limited customization options for advanced users.
- Can become expensive as the user base grows.
Pricing:
Custom pricing based on usage and requirements.
6. Tableau
Tableau is renowned for its ability to create a wide variety of visualizations and interactive dashboards, making data easily accessible to non-technical users. Named a Leader in Gartner’s 2024 Magic Quadrant for Analytics and BI Platforms, Tableau remains the benchmark for data visualization quality.
Pros:
- Extensive data visualization options.
- Integration with multiple data sources.
Cons:
- Higher learning curve for advanced features.
- Higher price point vs. alternatives.
Pricing:
Starting at $70/user/month.

Simplify Data Analytics with Infomineo
Not sure which tool fits your needs? Let Infomineo handle your data analytics, offering expertise in both tools and strategy to deliver actionable insights.

7. TIBCO Spotfire
TIBCO Spotfire is an intelligent analytics platform that combines machine learning, AI, and natural language processing to deliver powerful insights. It is particularly strong in life sciences, energy, and manufacturing — industries requiring advanced analytics on large, high-complexity datasets.
Pros:
- Combines AI and machine learning for advanced analytics.
- Highly customizable and scalable for enterprise needs.
Cons:
- Complex interface for first-time users.
- Requires significant training for advanced features.
Pricing:
Custom pricing available based on requirements.
8. Qlik
Qlik offers a powerful suite of business intelligence tools, including QlikView and Qlik Sense, enabling users to create interactive dashboards and perform in-depth analysis. Its unique associative analytics engine allows users to explore data connections that traditional query-based tools would miss.
Pros:
- Strong associative analytics engine for uncovering hidden trends.
- Highly interactive and user-friendly interface.
Cons:
- Can be expensive for small businesses.
- Steeper learning curve for new users.
Pricing:
Starting at $30/user/month for Qlik Sense Business.
9. Google Looker Studio
Google Looker Studio (formerly Google Data Studio) is a free, web-based tool that allows users to create customizable, interactive dashboards and reports. It integrates seamlessly with Google Analytics, Search Console, BigQuery, and hundreds of third-party connectors, making it the go-to choice for marketing and digital analytics teams.
Pros:
- Completely free to use.
- Easy integration with Google services like Google Analytics, Sheets, and BigQuery.
Cons:
- Limited advanced analytics capabilities.
- Performance may lag with large datasets.
Pricing:
Free.
10. Redash
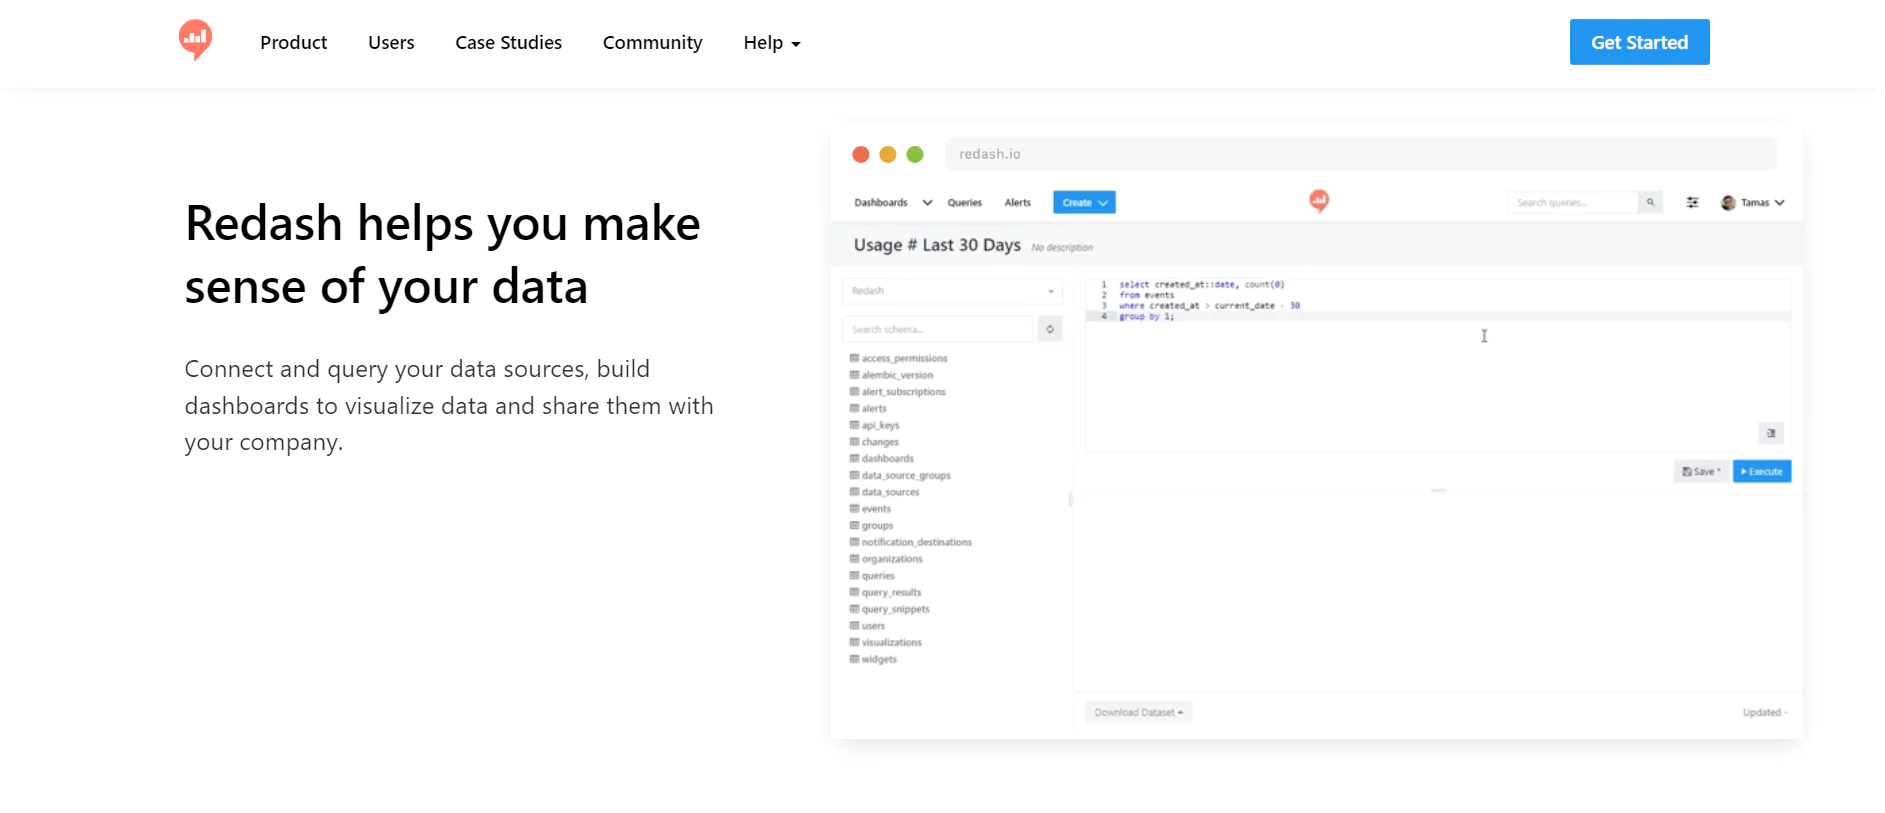
Redash is an open-source tool designed for query writing, data visualization, and collaborative dashboards. It’s particularly popular among data engineers and analyst teams working primarily with SQL databases who want a lightweight, cost-effective solution.
Pros:
- Supports a wide range of SQL databases and other data sources.
- Open-source and cost-effective for teams with technical expertise.
Cons:
- Requires SQL knowledge for effective use.
- Limited pre-built visualization options.
Pricing:
Starts at $49/month for hosted plans; free for self-hosted versions.
11. Oracle Analytics Cloud
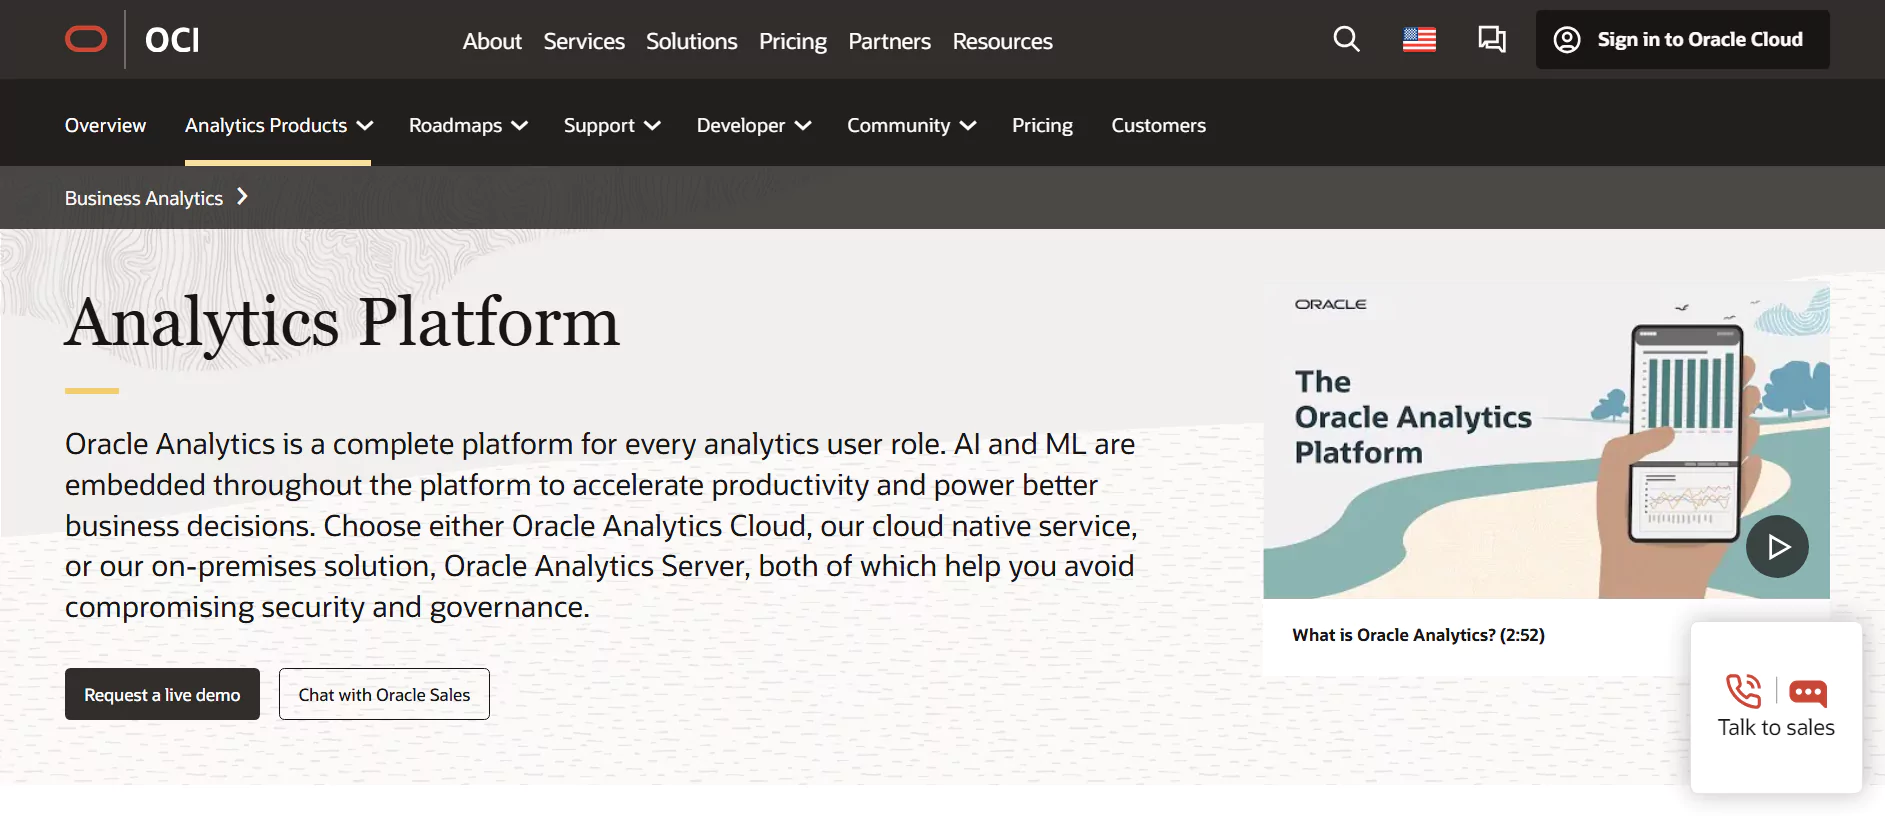
Oracle Analytics Cloud is a comprehensive analytics platform that combines AI-powered insights with robust data visualization and reporting tools. It’s ideal for enterprises already within the Oracle ecosystem seeking scalable and secure analytics solutions at cloud scale.
Pros:
- AI-powered analytics for predictive insights.
- Seamless integration with Oracle’s cloud ecosystem.
- Highly scalable for growing businesses.
Cons:
- Complex setup for non-technical users.
- High licensing costs for small businesses.
Pricing:
Custom pricing based on usage and enterprise requirements.
12. Metabase
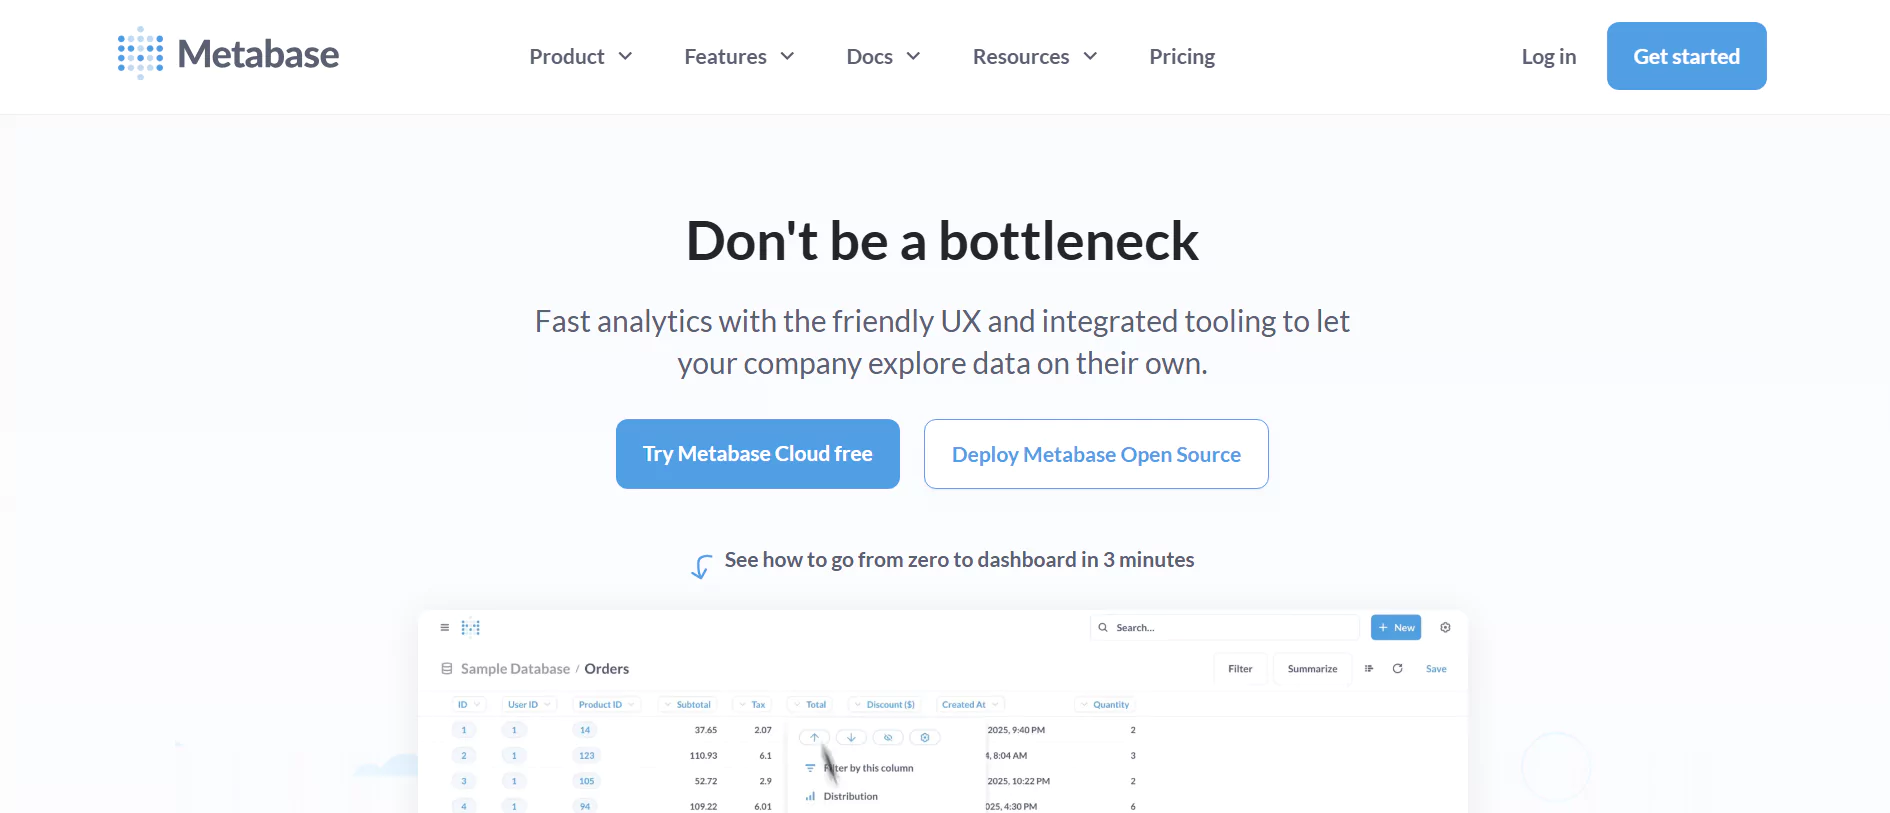
Metabase is a user-friendly open-source business intelligence tool that allows users to analyze data and build dashboards without requiring SQL expertise. It is widely adopted by startups and product teams that need quick, accessible data exploration without heavy implementation overhead.
Pros:
- No coding required for basic analytics and queries.
- Free open-source version available.
Cons:
- Limited features compared to enterprise-grade tools.
- Advanced customization requires technical knowledge.
Pricing:
Free for open-source version; hosted plans start at $85/month.
13. Jupyter Notebook
Jupyter Notebook is an open-source web-based tool for creating and sharing documents with live code, equations, visualizations, and narrative text. Used by over 10 million data scientists and researchers globally (Project Jupyter, 2024), it is the standard environment for exploratory data analysis and machine learning development.
Pros:
- Highly flexible and supports multiple programming languages.
- Free and open-source, with extensive community support.
Cons:
- Requires programming knowledge (e.g., Python, R).
- Lacks enterprise-level collaboration features.
Pricing:
Free.
14. IBM Cognos Analytics
IBM Cognos Analytics is a robust business intelligence suite that combines AI-driven analytics with advanced reporting and visualization capabilities. It’s a powerful choice for large enterprises in regulated industries where data governance, audit trails, and security are non-negotiable requirements.
Pros:
- AI-powered insights for advanced analytics.
- Seamless integration with IBM’s ecosystem and third-party tools.
Cons:
- High cost for implementation and maintenance.
- Steep learning curve for non-technical users.
Pricing:
Custom pricing based on enterprise needs.
15. Chartio (Atlassian)

Chartio was a cloud-based business intelligence tool that simplified data visualization and exploration. It was acquired by Atlassian and is no longer actively developed as a standalone product — teams that used Chartio have largely migrated to Tableau, Metabase, or Looker Studio depending on their complexity needs.
Pros:
- User-friendly interface with drag-and-drop functionality.
- Integration with multiple databases and data sources.
Cons:
- Limited customization options for advanced users.
- No longer actively developed (acquired by Atlassian).
Pricing:
No longer available as a standalone product.
16. Mode Analytics
Mode is a collaborative analytics platform that empowers data teams to perform advanced analysis and build visualizations with Python, R, and SQL support. It bridges the gap between raw code-based analysis and shareable business reporting, making it a strong fit for analytics-forward organizations.
Pros:
- Supports advanced analysis with built-in Python and R notebooks.
- Excellent collaboration features for data teams.
Cons:
- Requires technical expertise for effective use.
- Limited automation capabilities for large-scale reporting.
Pricing:
Custom pricing based on team size and usage.
17. KNIME
KNIME is an open-source data analytics platform that supports advanced analytics, data mining, and machine learning through its modular and visual workflow interface. It is widely used in pharmaceutical research, financial modeling, and academic settings where reproducible, auditable workflows are essential.
Pros:
- Free and open-source with a strong community.
- Supports advanced machine learning and data mining workflows.
Cons:
- Requires significant expertise for setup and usage.
- Can be slow with extremely large datasets.
Pricing:
Free for open-source; enterprise versions are custom-priced.
18. Looker (Google Cloud)
Looker, now part of Google Cloud, provides a business intelligence platform with powerful analytics and data exploration capabilities. Its LookML modeling layer gives data teams full control over business metrics definitions, making it especially strong for organizations that need consistent, governed metrics across every dashboard and report.
Pros:
- Flexible and customizable data modeling via LookML.
- Seamless integration with Google Cloud services.
Cons:
- High cost for small teams or startups.
- Requires technical expertise to fully leverage its features.
Pricing:
Custom pricing based on usage and team size.
19. RapidMiner (Altair AI Studio)
RapidMiner (now Altair AI Studio) is a data science platform that simplifies machine learning and predictive analytics for businesses through its drag-and-drop interface and wide range of algorithm support. It’s particularly well-suited for teams that need to build predictive models without deep coding expertise.
Pros:
- Comprehensive machine learning and predictive analytics capabilities.
- User-friendly drag-and-drop interface.
Cons:
- Can be resource-intensive for complex workflows.
- Limited free version functionality.
Pricing:
Free basic version; enterprise plans start at $2,500/year.
20. Domo
Domo is a cloud-based business intelligence platform that focuses on real-time data visualization and collaboration. Its strength lies in its ability to connect hundreds of data sources, surface KPI dashboards instantly, and enable non-technical executives to self-serve insights across the organization.
Pros:
- Real-time data processing and sharing.
- Comprehensive collaboration features for teams.
Cons:
- High cost for small businesses.
- Steep learning curve for non-technical users.
Pricing:
Custom pricing available upon request.
Which Data Analysis Tool Is Right for Your Team? A Quick Decision Guide
With 20 tools reviewed, the right choice depends on the intersection of your team’s technical level, your primary use case, and your budget. According to Forrester (2024), organizations that match their analytics tool selection to team skill profile see 43% higher adoption rates than those that select based on feature breadth alone. The quick-reference guide below maps the most common scenarios to the best-fit tools from this list.
| Your Situation | Best-Fit Tools | Skill Level |
|---|---|---|
| Non-technical team needing quick dashboards | Power BI, Tableau, Google Looker Studio, Domo | No-code / Low-code |
| Small team or startup on a tight budget | Google Looker Studio, Metabase, Jupyter Notebook, KNIME | Free options |
| Data scientists building ML models | Jupyter Notebook, KNIME, RapidMiner, Mode | Technical |
| Large enterprise with complex data governance | SAP BusinessObjects, SAS BI, IBM Cognos, Oracle Analytics Cloud | Enterprise |
| SQL-first data engineering team | Redash, Mode, Looker, Metabase | SQL proficiency |
| Team needing AI-powered natural language queries | ThoughtSpot, Power BI (Copilot), Oracle Analytics Cloud | No-code / AI-assisted |
| Marketing and digital analytics focus | Google Looker Studio, Tableau, Power BI, Domo | Low-code |
| Google Cloud-native stack | Looker, Google Looker Studio, BigQuery + Jupyter | Cloud-native |
Infomineo: Expert Data Analytics Services
Navigating the complexity of data analysis tools is challenging — and tool selection is only part of the equation. Infomineo specializes in turning raw data into actionable business insights, supporting clients across consulting firms, Fortune 500 companies, financial institutions, and governments.
Whether you need help managing tools like Tableau or Power BI, building custom dashboards, or require a fully managed data analytics solution, Infomineo provides the expertise, tool knowledge, and analytical rigor to deliver insights that drive real decisions. Learn more about our business research capabilities.
FAQs
What is the best data analysis tool for beginners?
For beginners with no coding background, Microsoft Power BI and Google Looker Studio are the most accessible starting points. Power BI offers a free tier, integrates seamlessly with Excel, and has a large community of tutorials. Looker Studio is fully free and requires no installation. For those with some SQL knowledge, Metabase offers a clean, intuitive interface without requiring full technical expertise. The right choice depends on whether your organization is already using Microsoft, Google, or another ecosystem.
What is the difference between business intelligence tools and data science tools?
Business intelligence (BI) tools — such as Tableau, Power BI, and Qlik — are designed for reporting, dashboard creation, and exploring structured data. They are primarily used by business analysts and non-technical users to track KPIs and answer operational questions. Data science tools — such as Jupyter Notebook, KNIME, and RapidMiner — are designed for statistical modeling, machine learning, and predictive analytics. They typically require programming knowledge and are used by data scientists to build models and extract deeper patterns from raw data.
Which data analysis tools are free?
Several tools on this list offer free tiers or are fully open-source: Google Looker Studio (fully free), Jupyter Notebook (fully free and open-source), Metabase (free open-source version), KNIME (free open-source), Redash (free self-hosted version), and RapidMiner (free basic version). Power BI also offers a free desktop version, though collaboration and publishing features require a paid plan. For most small teams and individual analysts, Google Looker Studio or Jupyter Notebook provide excellent capabilities at zero cost.
Is Python or Tableau better for data analysis?
Python (typically used via Jupyter Notebook) and Tableau serve fundamentally different purposes. Python is best for complex statistical analysis, machine learning, data cleaning, and working with unstructured data — it requires coding skill but offers virtually unlimited analytical flexibility. Tableau is best for creating fast, high-quality interactive visualizations and dashboards from clean, structured data — it requires no coding but is less suited to deep statistical work. Many professional data teams use both: Python for data preparation and modeling, Tableau for communicating results to non-technical stakeholders.
How does AI change data analysis tool selection in 2026?
AI is reshaping data analysis tools significantly in 2026. Most major platforms now include AI-assisted features — Power BI has Copilot for natural language querying, ThoughtSpot is built around AI-powered search, and Oracle Analytics Cloud offers automated insight generation. These capabilities lower the technical barrier for non-data users, meaning teams that previously needed SQL or Python skills can now ask questions in plain language and get meaningful results. When evaluating tools in 2026, assessing the quality and integration depth of AI features — not just traditional visualization capabilities — should be a primary selection criterion.
How does Infomineo use data analysis tools?
Infomineo’s analytics teams work with a range of data analysis tools — including Tableau, Power BI, Python environments, and premium database platforms — to deliver structured research and analytics services for clients across industries. Rather than being tool-dependent, Infomineo selects the analytical approach and toolset based on each client’s specific research question, data availability, and output requirements. This ensures that the analysis is both methodologically rigorous and directly actionable. Learn more about our data analytics services.
What should I consider when switching data analysis tools?
Switching data analysis tools involves more than just feature comparison. Key considerations include: data migration complexity (how difficult is it to move existing dashboards and pipelines?), retraining requirements for your team, integration compatibility with your current data stack, total cost of ownership over 12–36 months, and vendor stability. Gartner (2024) recommends running a structured pilot with real use cases before committing to full migration — tools that perform well in demos often reveal limitations only when used on your actual data and workflows.