

Best Monitoring Tools in 2026: The Ultimate Guide for Every Business

Table of Contents
The era of reactive IT operations is over. As businesses become more dependent on cloud infrastructure, distributed applications, and real-time data pipelines, the stakes of downtime — lost revenue, damaged reputation, frustrated users — have never been higher. The question is no longer whether to monitor your systems, but how fast you can act when something goes wrong.
Picture catching a server bottleneck before it crashes your application, tracking user experience in real time across thousands of endpoints, and receiving intelligent alerts the moment an anomaly appears — all from a single dashboard. This isn’t a DevOps fantasy — it’s what modern monitoring tools deliver today. From startups running lean cloud infrastructure to enterprises managing global distributed systems, organizations that invest in the right monitoring stack are the ones that stay up, stay fast, and stay ahead.
We’ve curated 15+ leading monitoring tools that are redefining how teams observe, diagnose, and optimize their infrastructure, applications, and user experience. Each platform has been selected for its practical impact on real operational challenges — from uptime monitoring and log management to APM, network observability, and synthetic testing. Whether you’re building your first monitoring setup or scaling an enterprise-wide observability program, these tools represent the gold standard of the industry.
Welcome to the era of proactive observability — where you find the problem before your users do.
What Are Monitoring Tools?
Monitoring tools are software platforms that continuously track the health, performance, and availability of IT systems — including servers, applications, databases, networks, and end-user experiences. They collect metrics, logs, and traces in real time, alerting teams to anomalies before they escalate into outages or performance degradation that directly impacts business operations.
At their core, modern monitoring platforms cover four critical pillars: infrastructure monitoring (tracking server CPU, memory, disk, and cloud resource utilization), application performance monitoring (APM) (tracing request flows, identifying bottlenecks, and measuring response times across services), log management (aggregating, parsing, and searching logs from distributed systems), and synthetic and real-user monitoring (RUM) (simulating user interactions and measuring actual end-user experience metrics).
The distinction between tool categories matters. Some platforms focus exclusively on infrastructure and cloud monitoring (e.g., Datadog, Zabbix), while others specialize in full-stack APM and distributed tracing (e.g., New Relic, Dynatrace). Choosing the right type depends on your stack complexity, team size, observability maturity, and the specific blind spots you’re trying to eliminate.
📖 Want to go deeper? Read our comprehensive guide on building a full observability strategy for your organization: Infomineo AI & Technology Research →
Best Monitoring Tools in 2026
You can’t manage what you can’t measure — and in today’s distributed systems, observability is not optional, it’s survival.
1. Datadog
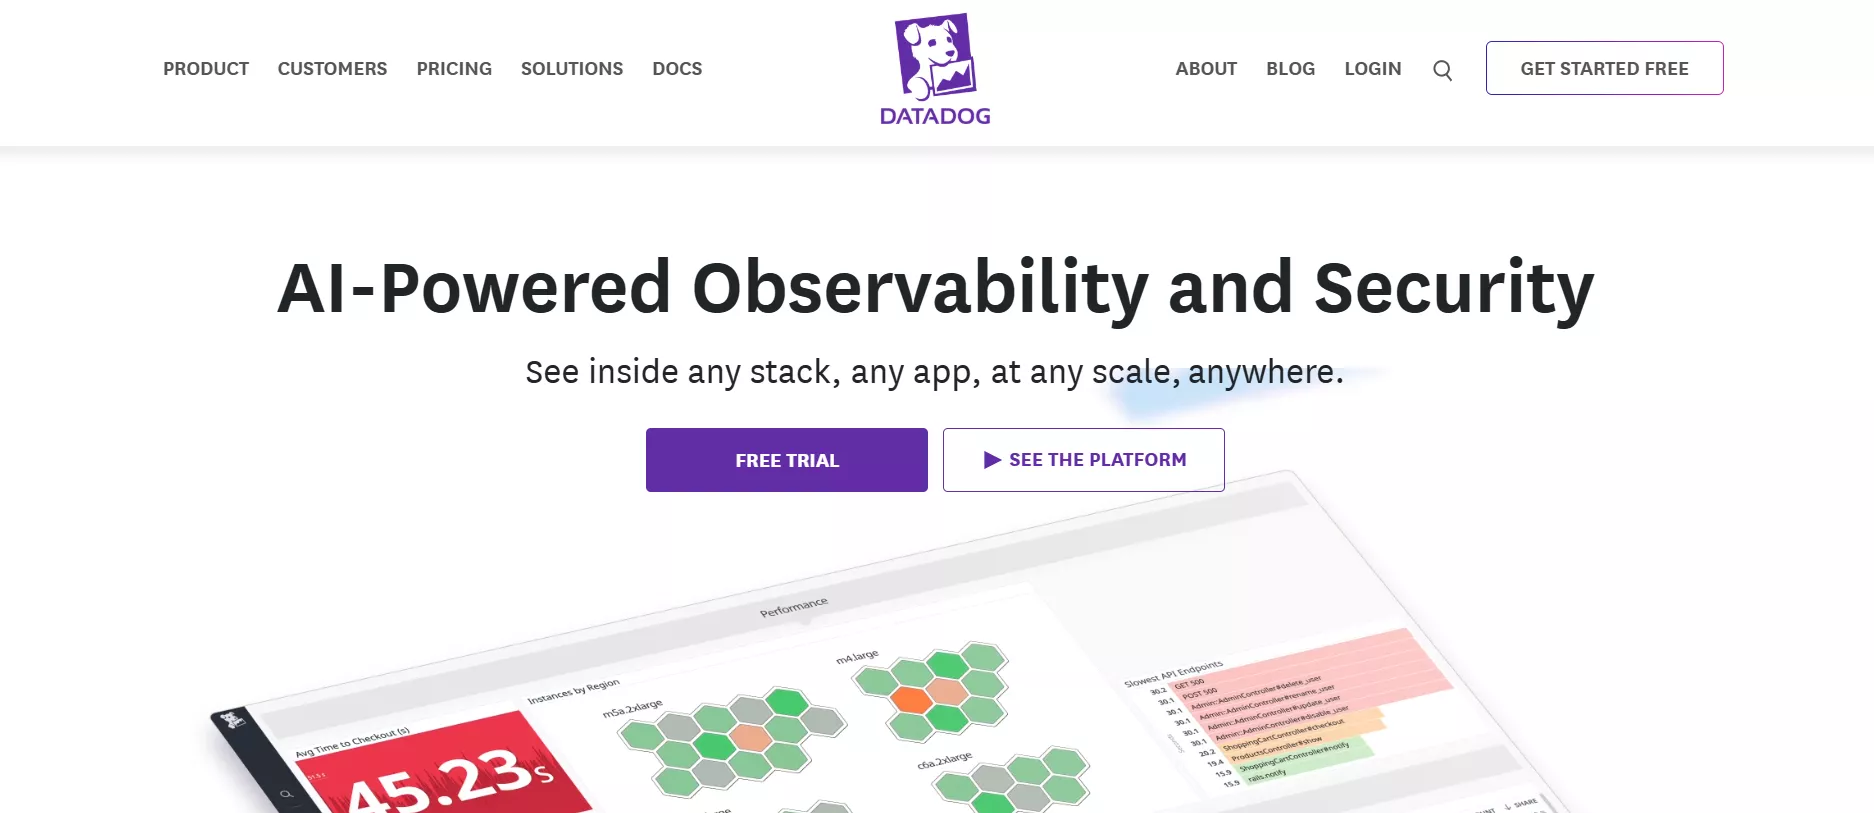
Datadog is the industry’s leading cloud monitoring and observability platform, combining infrastructure monitoring, APM, log management, synthetic testing, and security monitoring into a single unified interface — making it the go-to choice for cloud-native teams running complex, distributed architectures.
Pros:
- Best-in-class integrations — 700+ out-of-the-box integrations with cloud services, databases, and frameworks.
- Unified platform covering infrastructure, APM, logs, RUM, and security in one dashboard.
Cons:
- Costs can escalate quickly at scale — pricing is based on hosts and data volume.
- Can be overwhelming for small teams without a dedicated DevOps function.
Pricing:
Free plan available for up to 5 hosts; paid plans start at $15/host/month for infrastructure monitoring.
2. New Relic
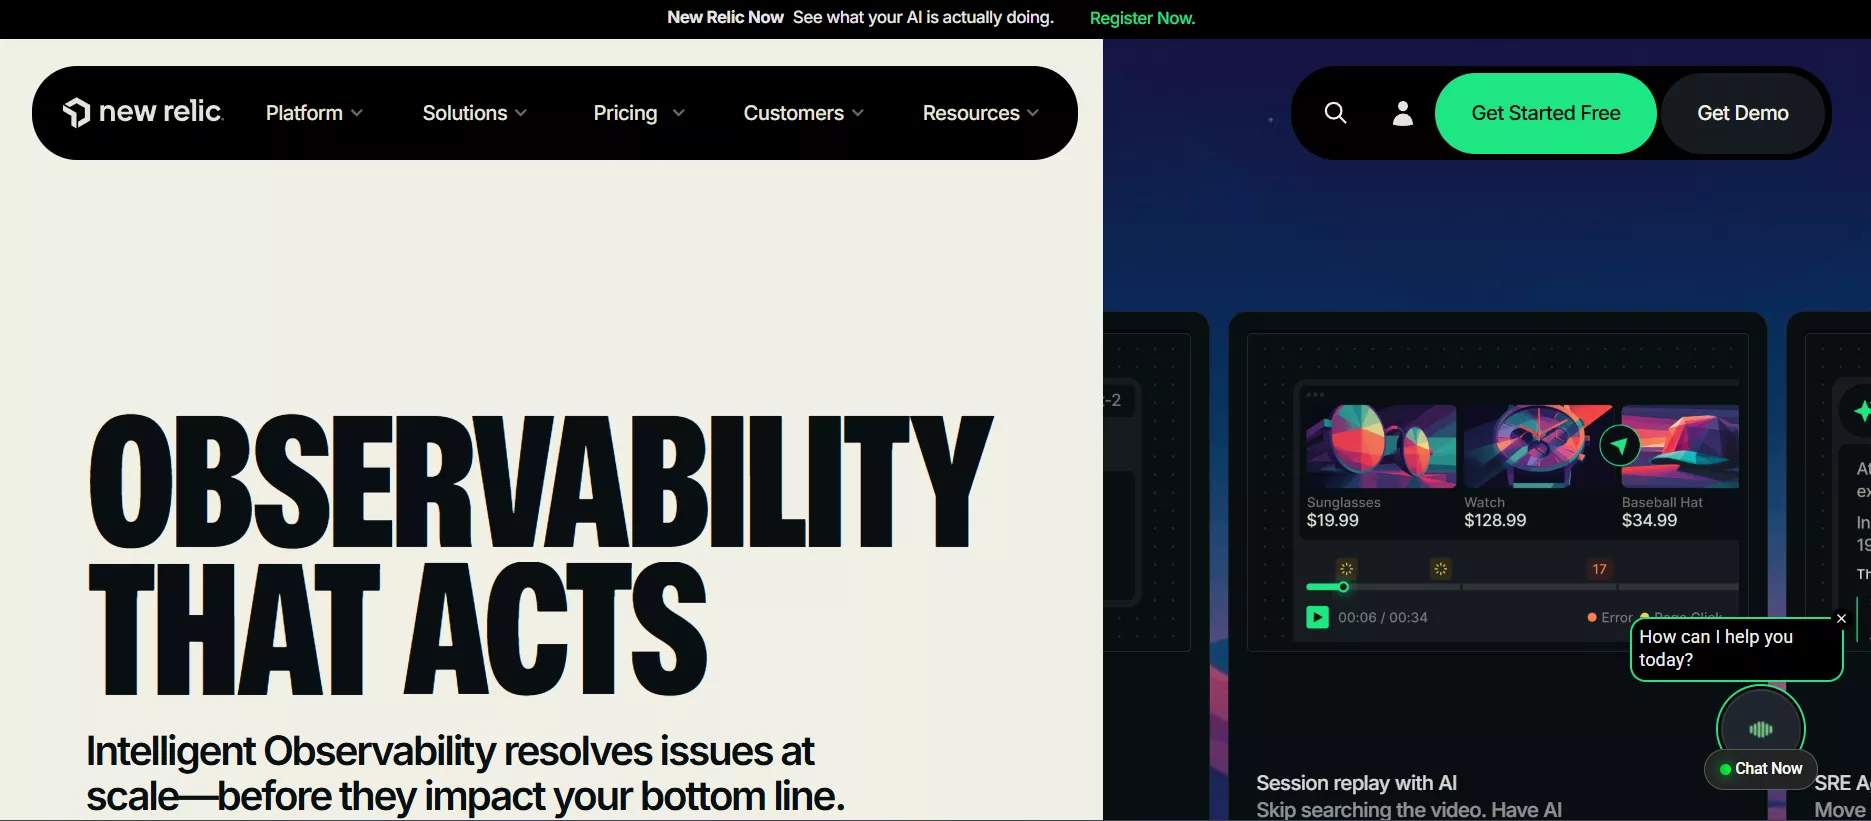
New Relic is a full-stack observability platform that provides application performance monitoring, infrastructure visibility, log analytics, and real user monitoring — all backed by a generous free tier and a usage-based pricing model that makes it accessible for teams of all sizes.
Pros:
- Generous free tier — 100GB of data ingest/month with full platform access for 1 user.
- Powerful distributed tracing and AI-assisted anomaly detection built in.
Cons:
- Data ingest-based pricing can be unpredictable for high-volume logging environments.
- UI complexity can slow onboarding for teams new to observability platforms.
Pricing:
Free tier: 100GB/month + 1 full user. Pro plans start at $0.30/GB ingested beyond the free tier.
3. Dynatrace
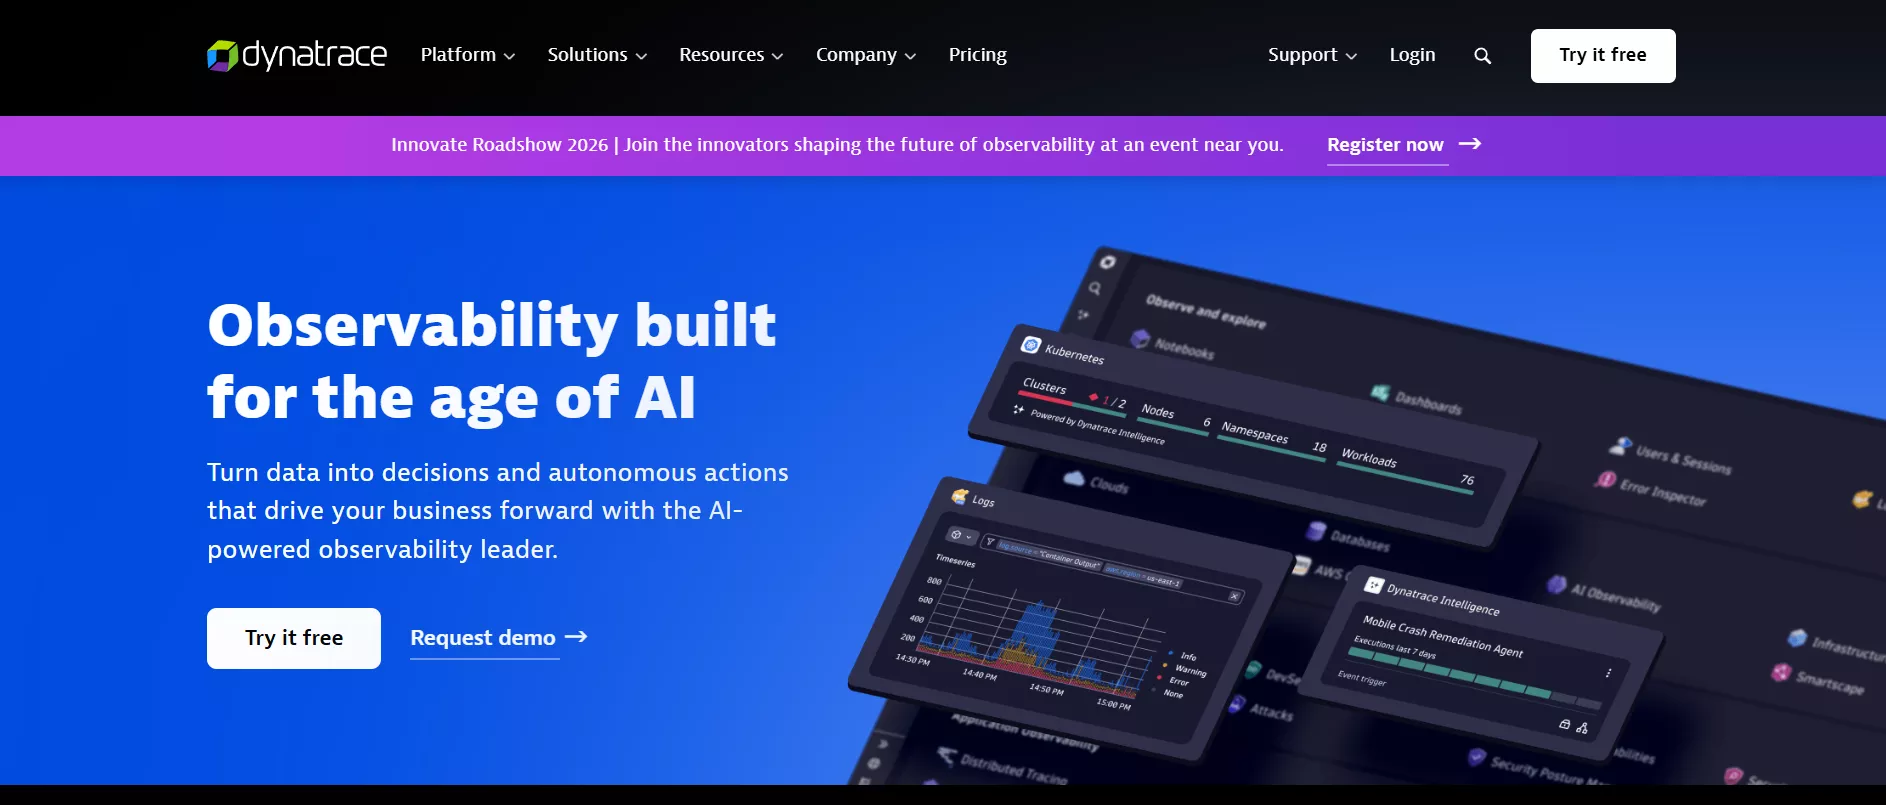
Dynatrace sets itself apart with its AI engine, Davis AI, which automatically detects root causes, correlates anomalies across the full stack, and prioritizes alerts — reducing alert fatigue and enabling teams to go from detection to resolution in minutes rather than hours.
Pros:
- Davis AI delivers automatic root cause analysis — no manual alert correlation needed.
- Best-in-class for enterprise environments with thousands of services and microservices.
Cons:
- Premium pricing puts it out of reach for startups and smaller engineering teams.
- Initial configuration and onboarding requires significant time investment.
Pricing:
15-day free trial available; full-stack monitoring starts at approximately $0.08/hour per 8 GiB host.
4. Grafana
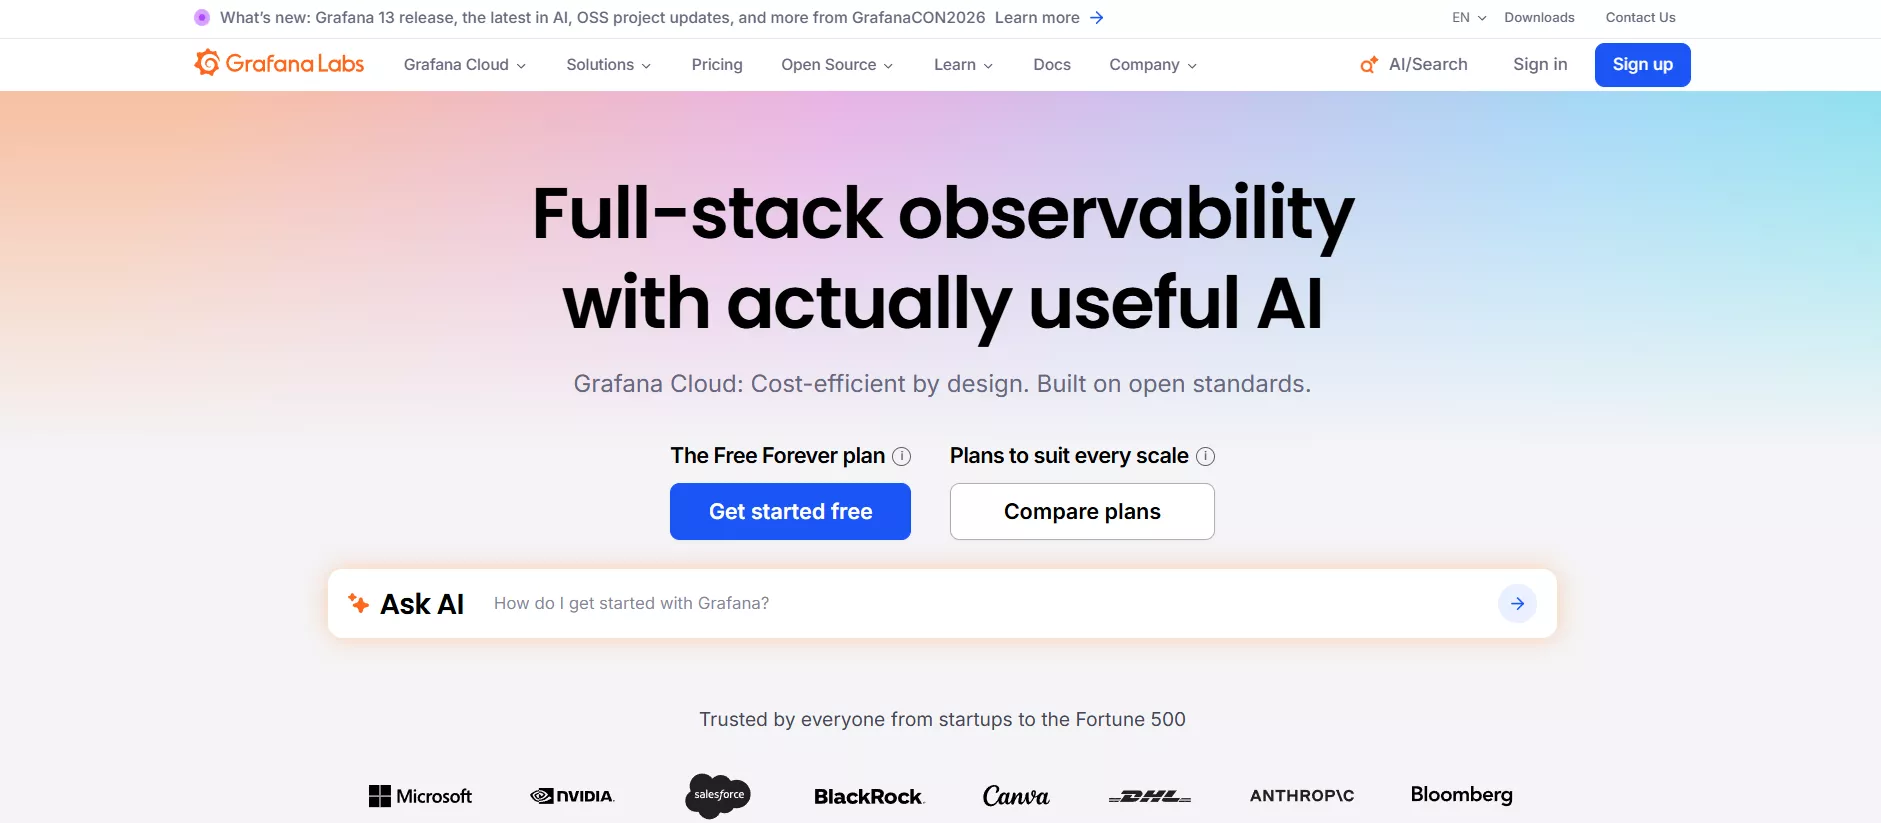
Grafana is the world’s most popular open-source observability platform, offering powerful, customizable dashboards that connect to virtually any data source — from Prometheus and InfluxDB to cloud providers and databases — making it the visualization backbone of modern monitoring stacks worldwide.
Pros:
- Open-source core is completely free — massive community with thousands of pre-built dashboards.
- Connects to 150+ data sources natively — unmatched flexibility for diverse monitoring stacks.
Cons:
- Requires self-hosting setup or Grafana Cloud subscription — not plug-and-play out of the box.
- Dashboard building demands technical expertise; less accessible for non-engineering stakeholders.
Pricing:
Open-source: free (self-hosted). Grafana Cloud free tier available; Pro starts at $8/user/month.
5. Prometheus
Prometheus is the de facto standard for metrics collection and alerting in Kubernetes and cloud-native environments, offering a powerful time-series database, a flexible query language (PromQL), and a pull-based scraping model that integrates natively with virtually every modern cloud infrastructure tool.
Pros:
- CNCF-graduated project — industry standard for Kubernetes metrics collection.
- Completely free and open-source with an exceptionally active community and ecosystem.
Cons:
- Not designed for long-term storage — typically paired with Thanos or Cortex for retention.
- No built-in dashboarding — requires Grafana for visualization.
Pricing:
100% free and open-source. Managed Prometheus solutions available via AWS, Google Cloud, and Grafana Cloud.
6. PagerDuty
PagerDuty is the industry’s leading incident management and alerting platform, turning monitoring signals from any source into intelligent, routed alerts with on-call scheduling, escalation policies, and AI-powered event correlation — ensuring the right engineer gets the right alert at exactly the right time.
Pros:
- Best-in-class on-call scheduling, escalation policies, and incident response workflows.
- 600+ integrations — connects to virtually any monitoring, logging, or alerting tool.
Cons:
- Primarily an alerting/incident layer — requires separate monitoring tools to generate signals.
- Advanced AIOps features locked in higher-tier plans.
Pricing:
Free plan for up to 5 users; Professional at $21/user/month; Business at $41/user/month.
7. Elastic Stack (ELK)
The Elastic Stack — comprising Elasticsearch, Logstash, and Kibana — is the gold standard for log aggregation, search, and analysis at scale, enabling teams to ingest terabytes of log data from any source, visualize it in real time, and build custom alerting rules across their entire infrastructure.
Pros:
- Unmatched log search and full-text query capabilities at petabyte scale.
- Highly customizable — flexible for security, observability, and business analytics use cases.
Cons:
- Self-managed deployments require significant infrastructure expertise and maintenance.
- Resource-intensive — high memory requirements can increase infrastructure costs.
Pricing:
Open-source core is free. Elastic Cloud managed service starts at $95/month; enterprise pricing available.
8. Splunk
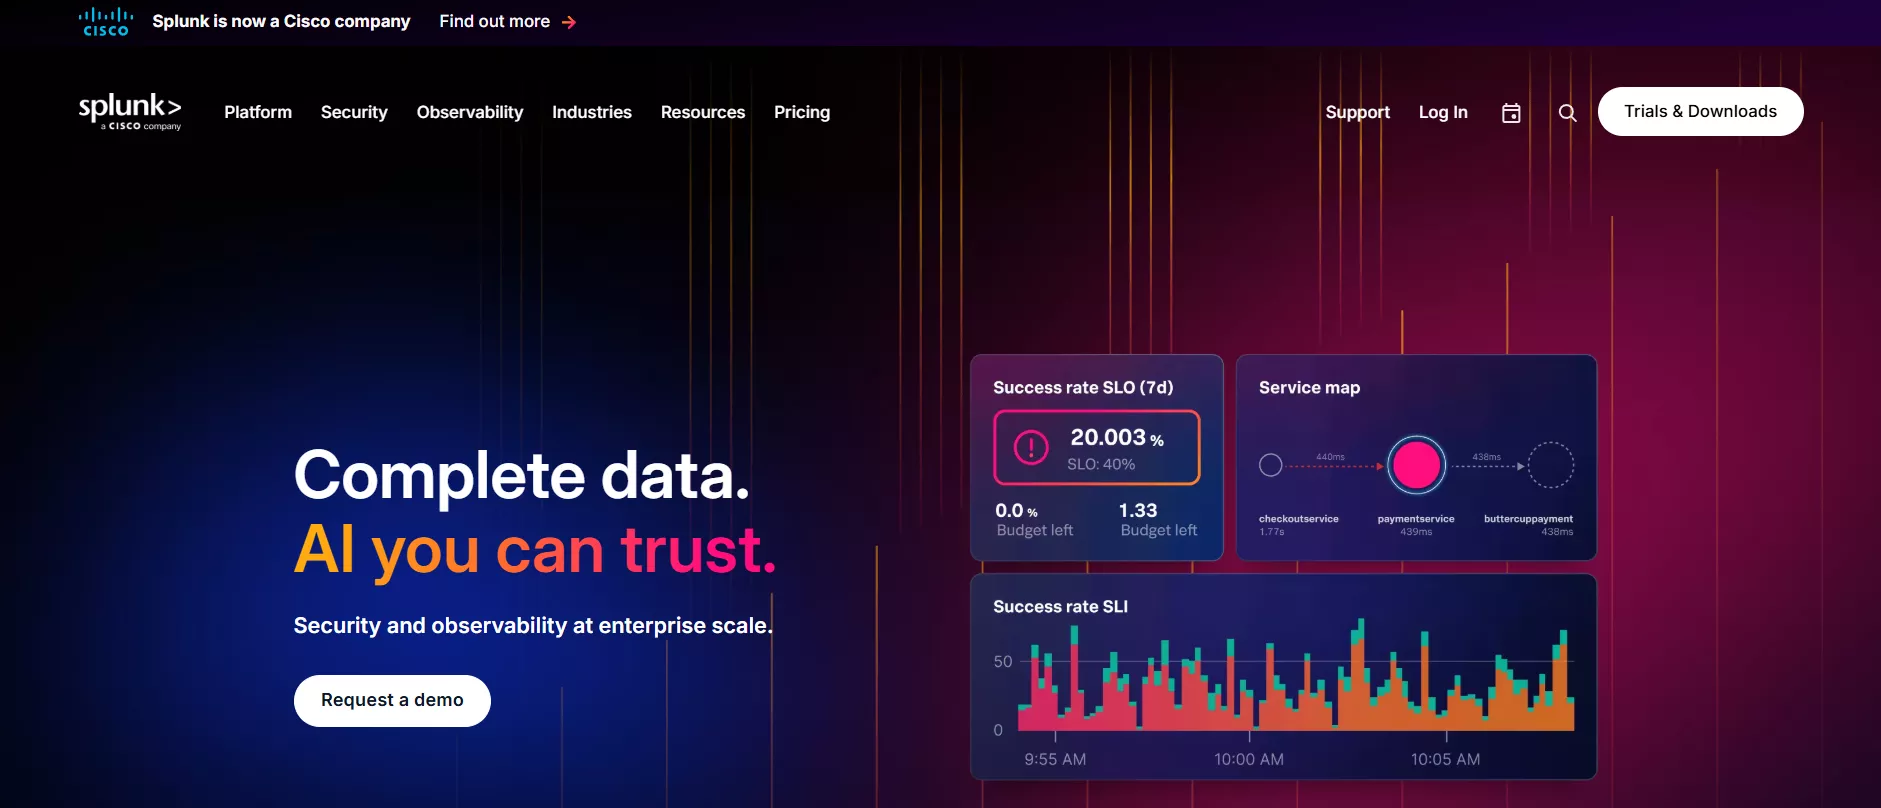
Splunk is an enterprise-grade observability and security platform that turns machine data — logs, metrics, traces, and events — into operational intelligence, enabling large organizations to monitor infrastructure, detect security threats, and correlate incidents across billions of events in real time.
Pros:
- Extremely powerful query language (SPL) for complex operational and security analytics.
- Deep integration with SIEM, SOAR, and IT service intelligence workflows.
Cons:
- One of the most expensive monitoring platforms — licensing costs are significant at scale.
- Steep learning curve for SPL queries and dashboard building.
Pricing:
Infrastructure-based and ingest-based licensing; enterprise contracts typically start at $150K/year.
9. Zabbix
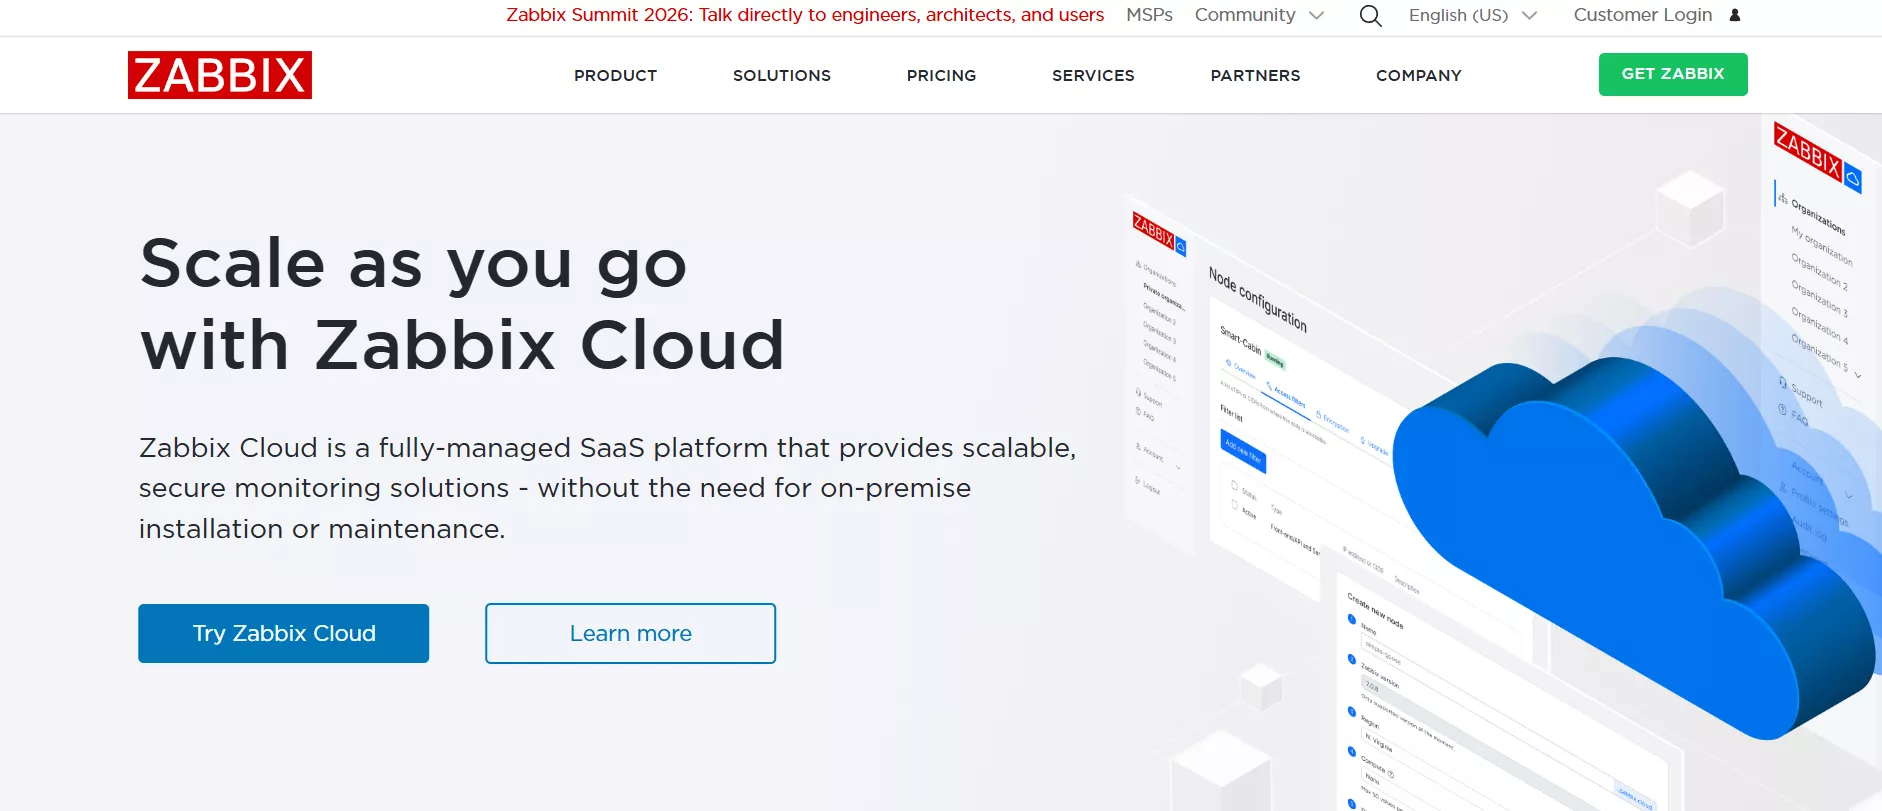
Zabbix is a battle-tested, open-source monitoring platform for networks, servers, applications, and cloud infrastructure — trusted by thousands of organizations globally for its flexibility, scalability, and zero licensing cost, making it the dominant choice for teams with strong technical skills and tight budgets.
Pros:
- Completely free and open-source — no licensing fees regardless of scale.
- Highly flexible templating system with strong network and SNMP monitoring support.
Cons:
- Dated UI compared to modern observability platforms — steeper learning curve for new users.
- Requires in-house expertise for setup, maintenance, and scaling.
Pricing:
100% free and open-source. Commercial support packages available from Zabbix LLC.
10. UptimeRobot
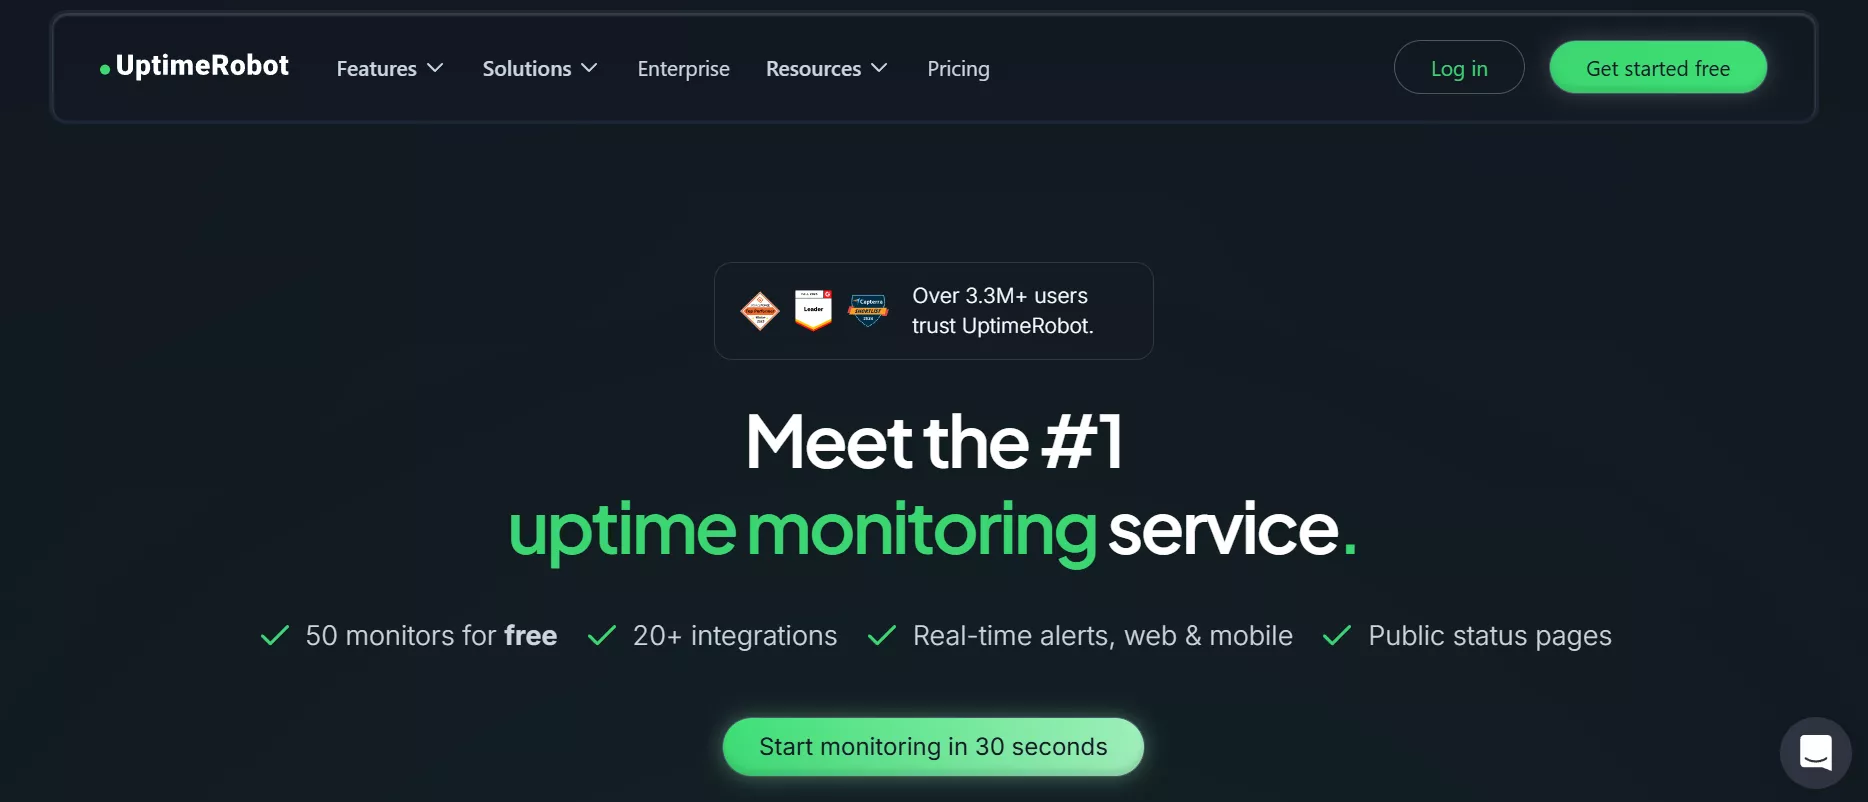
UptimeRobot is the most widely used website uptime monitoring tool on the market, checking your websites, APIs, and servers every minute from 14 global locations and instantly alerting you via email, SMS, Slack, or webhook the moment your service goes down — at a price point that even solo developers can afford.
Pros:
- Free plan monitors up to 50 websites at 5-minute intervals — exceptional value for small teams.
- Simple, intuitive setup — no DevOps expertise required to get started.
Cons:
- Limited to availability monitoring — not a full observability or APM solution.
- 1-minute check intervals and advanced features require a paid plan.
Pricing:
Free plan for 50 monitors (5-min checks); Pro starts at $7/month for 1-minute intervals and SSL monitoring.
11. SolarWinds
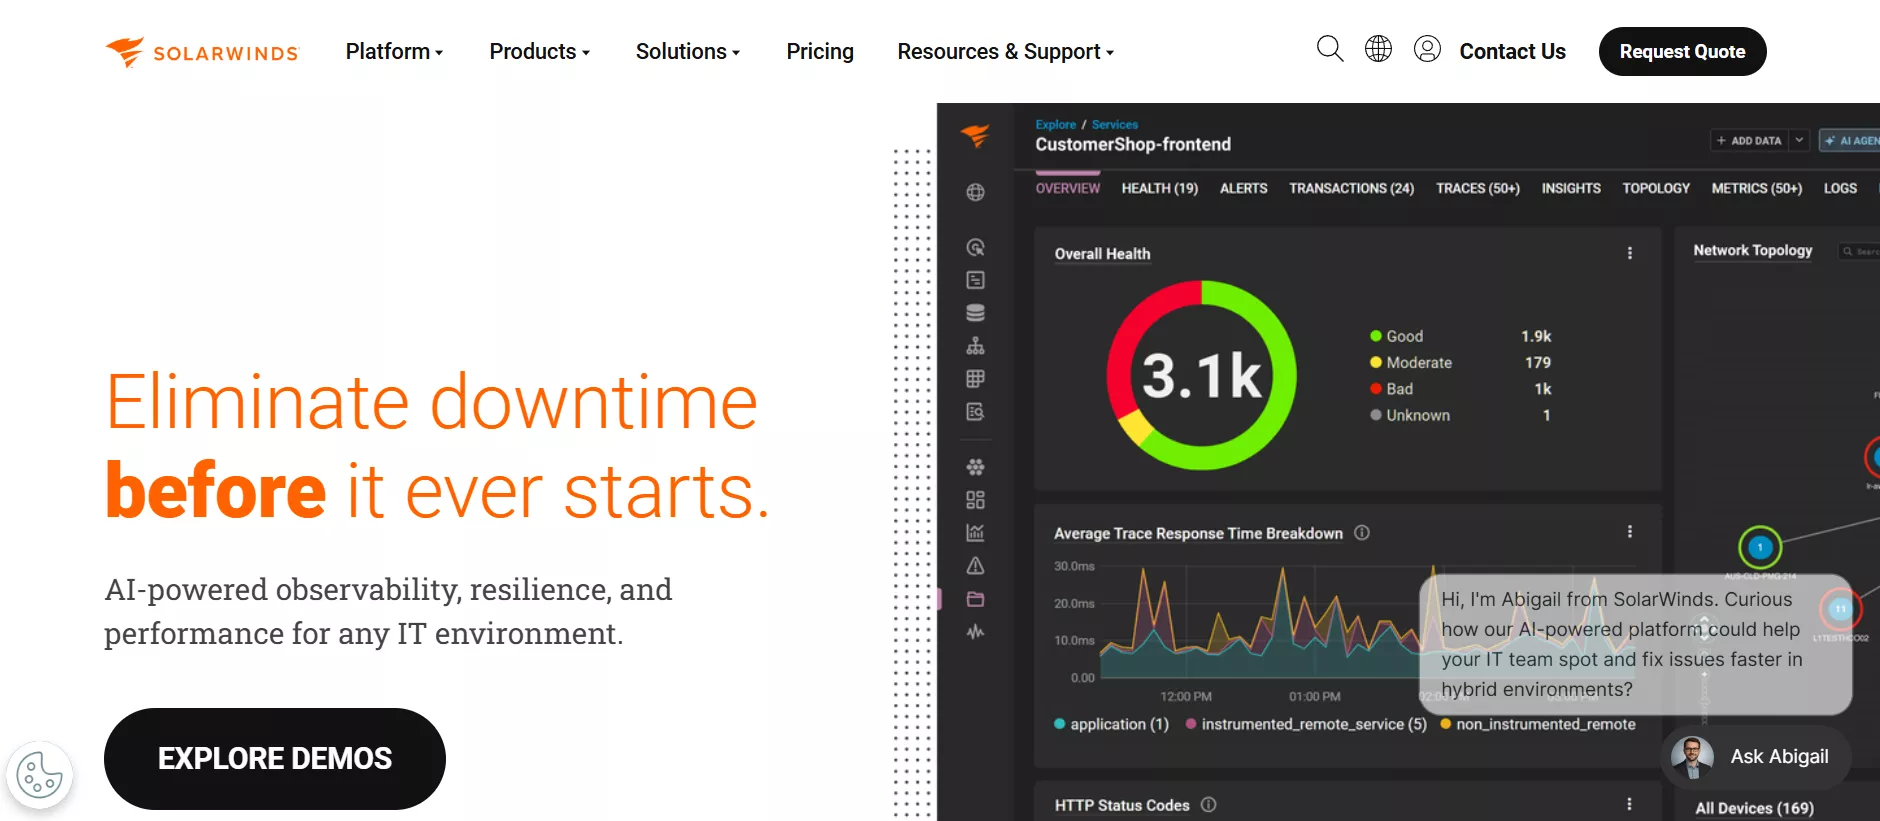
SolarWinds offers one of the most comprehensive IT monitoring suites on the market, covering network performance monitoring (NPM), server and application monitoring (SAM), database performance analysis, and network configuration management — making it the dominant choice for traditional enterprise IT and network operations teams.
Pros:
- Industry-leading network monitoring depth — unmatched for enterprise network operations teams.
- Modular product suite — buy only what you need across network, server, and application tiers.
Cons:
- Reputation impacted by the 2020 supply chain attack — requires careful security evaluation.
- On-premises licensing model can be expensive compared to SaaS-native competitors.
Pricing:
30-day free trial available; NPM starts at approximately $2,955/year (perpetual license).
12. Nagios

Nagios is the original open-source monitoring platform that helped define the modern monitoring space, offering comprehensive host, service, and network monitoring with an enormous plugin ecosystem built over 25+ years — making it deeply customizable for teams willing to invest in its configuration.
Pros:
- Massive plugin library — 5,000+ community-contributed plugins cover virtually any monitoring use case.
- Nagios Core is completely free and battle-tested in production for over two decades.
Cons:
- Configuration is entirely file-based — steep learning curve with no modern GUI for setup.
- Dated architecture struggles to compete with modern cloud-native monitoring platforms.
Pricing:
Nagios Core: free. Nagios XI (commercial) starts at $1,995 for 100 nodes.
13. AWS CloudWatch
AWS CloudWatch is the native monitoring and observability service for Amazon Web Services, providing metrics collection, log aggregation, alarms, dashboards, and automated actions for every AWS service — making it the natural starting point for any team already running workloads in the AWS ecosystem.
Pros:
- Native AWS integration — zero setup for monitoring EC2, Lambda, RDS, and all AWS services.
- Tight integration with CloudTrail, EventBridge, and AWS auto-scaling for automated remediation.
Cons:
- Costs grow fast with high log volume and frequent metric collection intervals.
- Limited visibility into non-AWS systems — not suitable as a primary tool for multi-cloud environments.
Pricing:
Pay-as-you-go; basic metrics free. Detailed monitoring from $0.30/metric/month; logs from $0.50/GB ingested.
14. Site24x7
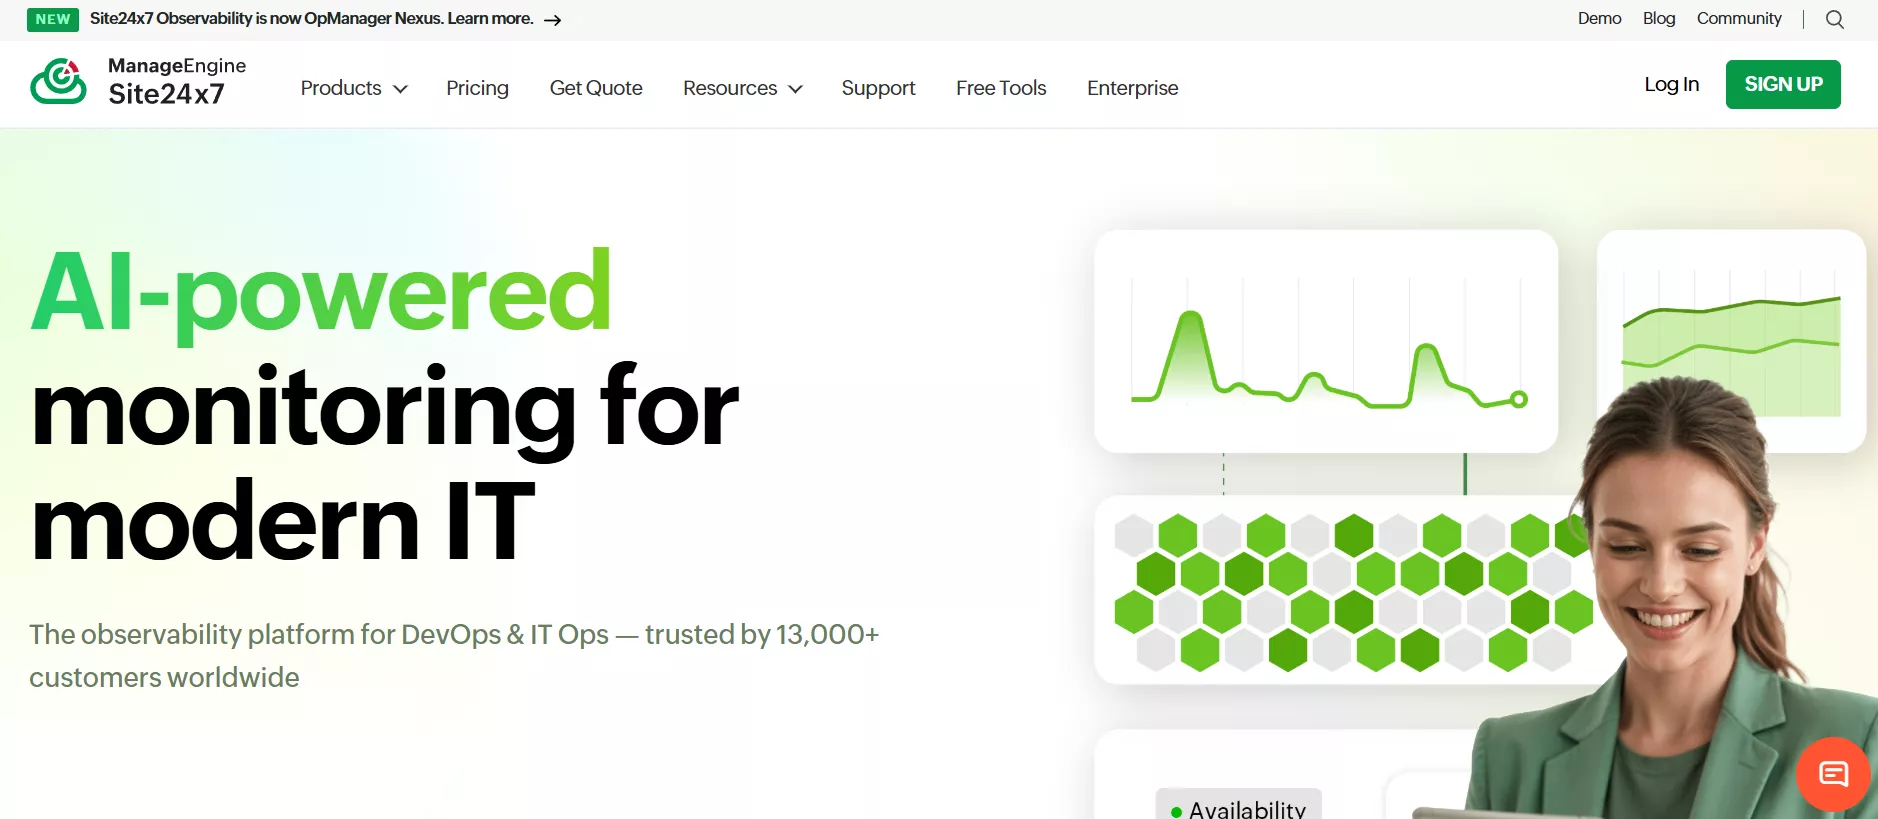
Site24x7 is a unified full-stack monitoring platform from Zoho that covers websites, servers, cloud infrastructure, applications, and network devices — offering an exceptionally broad feature set at a price point significantly below Datadog or Dynatrace, making it a compelling value choice for growing teams.
Pros:
- Broad monitoring coverage — websites, servers, cloud, network, and applications in one plan.
- AI-powered forecasting and anomaly detection included in standard tiers.
Cons:
- UI can feel cluttered with the sheer volume of features available across the platform.
- APM depth is not as mature as specialized competitors like Dynatrace or AppDynamics.
Pricing:
30-day free trial; plans start at $9/month for 10 basic monitors. Full-stack plans from $35/month.
15. Better Uptime
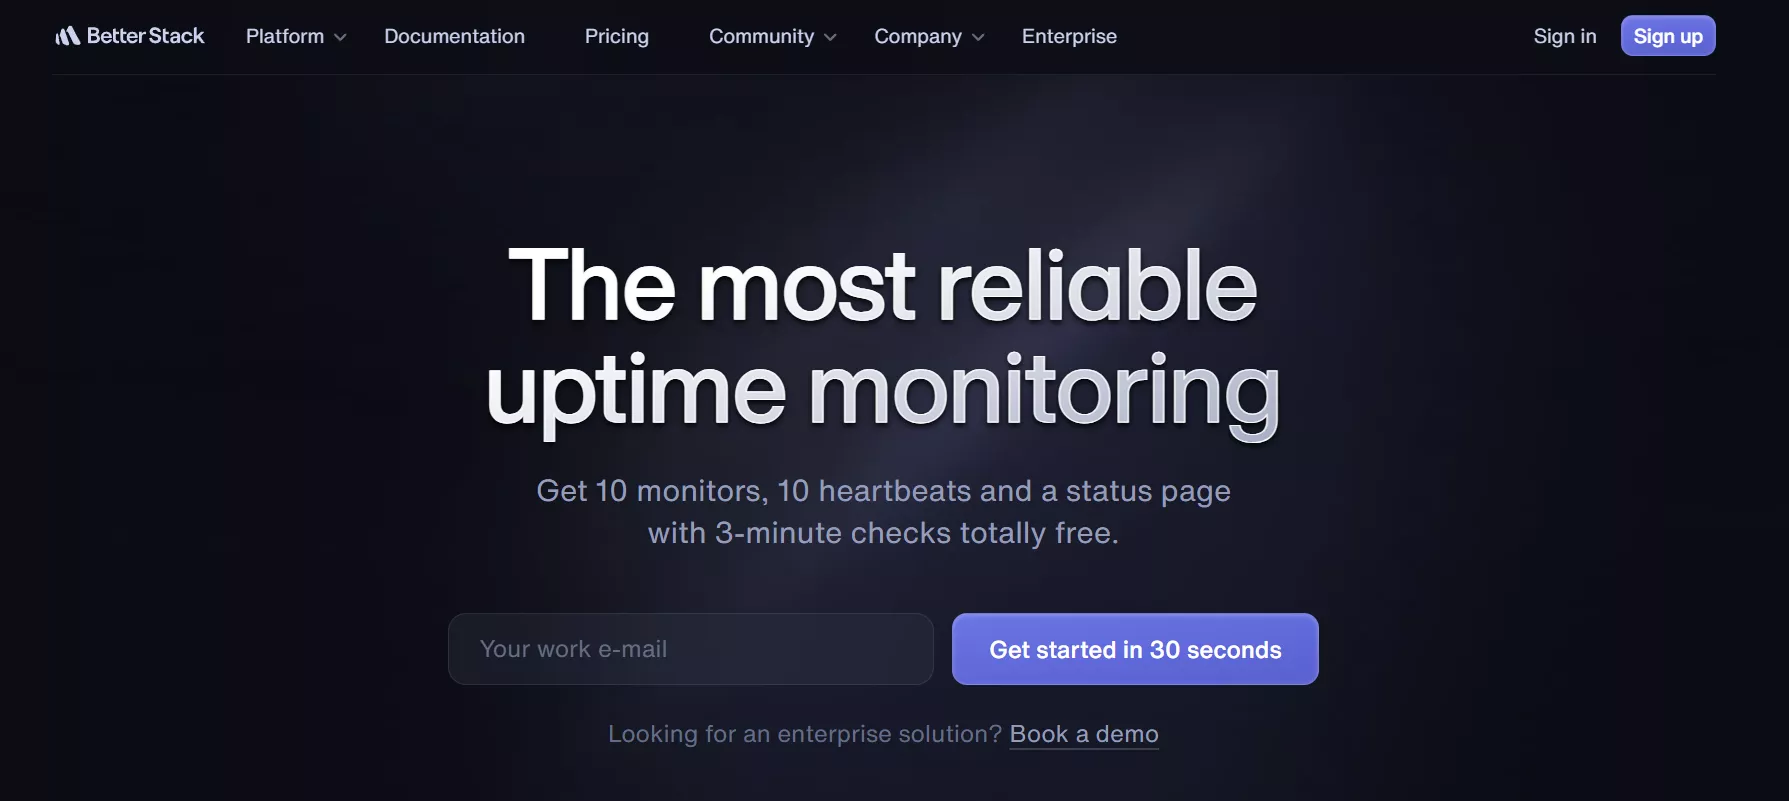
Better Uptime combines uptime monitoring, incident management, and beautiful public status pages into a single modern platform — offering phone call alerts, on-call scheduling, screenshot-based incident records, and integrations with Slack and PagerDuty in an interface that feels refreshingly clean compared to legacy monitoring tools.
Pros:
- Beautiful, brandable status pages included on all paid plans — exceptional for SaaS products.
- Phone call alerts on all plans — even the free tier — a rare feature at this price point.
Cons:
- Not a full observability platform — focused on uptime and incident communication.
- Advanced on-call features are less mature than dedicated tools like PagerDuty or OpsGenie.
Pricing:
Free plan available; Starter at $24/month; Team at $72/month. Annual billing discounts available.
How to Choose the Best Monitoring Tool
With dozens of monitoring platforms competing for your budget, the right choice isn’t the one with the longest feature list — it’s the one that solves your specific observability gaps without over-engineering your stack. Here are the six most important criteria to evaluate before making a decision.
① Define Your Monitoring Scope First
Are you primarily concerned with infrastructure and server health (Datadog, Zabbix, Nagios), application performance and distributed tracing (Dynatrace, New Relic), log aggregation and search (Elastic Stack, Splunk), or simple uptime and availability (UptimeRobot, Better Uptime)? Each category has purpose-built leaders. Buying a full-stack APM platform when you only need uptime checks is expensive overkill.
② Match the Tool to Your Infrastructure Type
If your team runs primarily on AWS, CloudWatch is your native starting point with zero setup overhead. Kubernetes and cloud-native environments pair naturally with Prometheus + Grafana. Traditional on-prem networks are best served by Zabbix, Nagios, or SolarWinds. Multi-cloud or hybrid organizations get the most out of vendor-agnostic platforms like Datadog or Dynatrace. Your infrastructure type should eliminate at least half of the candidates before you even compare features.
③ Be Honest About Your Team’s Technical Capacity
Open-source powerhouses like Prometheus, Grafana, and Nagios offer unmatched flexibility — but require dedicated engineering time to deploy, configure, and maintain. Managed SaaS platforms like Datadog, New Relic, and Site24x7 are faster to deploy and easier to maintain but cost more. If your team lacks dedicated DevOps resources, the “free” open-source option frequently costs more in engineering hours than a $1,000/year SaaS subscription. Be realistic about your capacity.
④ Understand How Pricing Scales with Your Growth
Monitoring pricing models vary dramatically — and the one that’s cheap today can become your largest infrastructure cost at scale. Host-based pricing (Datadog) can spike as you add servers. Data ingest pricing (New Relic, Elastic Cloud) surprises teams with high log volumes. Per-user pricing (PagerDuty, Grafana Cloud) stays predictable but limits team-wide access. Model your projected data volume and host count at 12 months and 24 months before committing to any vendor — cost surprises in monitoring are extremely common.
⑤ Prioritize Alert Quality Over Alert Volume
The most common failure mode of monitoring implementations isn’t the absence of alerts — it’s alert fatigue from too many low-quality ones. Evaluate how each platform handles alert deduplication, correlation, and noise reduction. Dynatrace’s Davis AI automatically groups related anomalies into a single root cause. PagerDuty’s Event Intelligence reduces alert noise by up to 98% in enterprise environments. A monitoring tool that generates 200 alerts per incident is worse than one that generates 1 actionable one. Treat alerting intelligence as a first-class evaluation criterion.
⑥ Always Run a Real-World Trial Before Committing
Every major monitoring platform offers a free trial — use it seriously. Connect it to a real production (or staging) environment, not a demo account. Simulate an actual incident and measure how fast the tool surfaces the root cause. Test the alerting workflow end-to-end with your team, including the on-call engineer who will receive a 3 AM page. Involve both your engineering team and your operations or business stakeholders in the evaluation. A monitoring tool that only engineers understand will never achieve full organizational buy-in — and that limits its real-world impact.
The right monitoring stack is no longer a nice-to-have — it is the operational backbone that separates teams who catch issues in seconds from those who learn about outages from frustrated customers. The tools in this guide represent the most capable, battle-tested platforms available in 2026 for building a proactive, observable, and resilient infrastructure.
Whether you need a full-stack observability platform for a complex microservices architecture, a lightweight uptime monitor for a growing SaaS product, or an enterprise log analytics engine to meet compliance and security requirements, the right tool exists for your team’s scale and technical maturity. The key is to start now — because downtime is always more expensive than the monitoring tool that would have prevented it.
At Infomineo, we help organizations navigate technology decisions through rigorous research, competitive benchmarking, and strategic advisory — ensuring your technology investments are grounded in data, not vendor marketing.
Need help evaluating monitoring tools for your organization? Our research experts are ready.
Get in Touch →